Reading ECGs (Electrocardiogram) in Dogs
Electrocardiography is the most useful diagnostic technique for characterizing cardiac rhythms; however, correlating what is recorded on the tracing with the electrical activity in the heart can be confusing. Veterinary nurses should have the skills needed to identify and characterize arrhythmias, which can be seen on electrocardiograms (ECGs) of patients being monitored during anesthesia, patients presented for various emergencies, and patients with known heart disease.
The waveforms produced during an ECG recording are reflective of specific portions of the heart’s electrical activity. The ECG provides information pertaining only to the electrical, not the mechanical, activity of the heart. An ECG will provide the information necessary to calculate heart rate (HR) and determine heart rhythm with the patient in any position. In the event of a suspected arrhythmia, a printed tracing simplifies interpretation.
What is an electrocardiogram?
An electrocardiogram (ECG) is a test that is commonly used to assess the heart. When your dog’s heart beats, an electrical impulse is generated within a region of the heart known as the pacemaker. This impulse passes through the heart in a predictable manner that can be traced on an ECG recording.
“An electrocardiogram (ECG) is a test that is commonly used to assess the heart.”By analyzing the electrical impulses produced as the heart beats, abnormalities within the heart can be found. These abnormalities may include issues such as arrhythmias (irregular heartbeats), abnormalities in the size and structure of the various heart chambers, abnormal conduction, and other defects of the heart.
How is an electrocardiogram performed?
In most cases, an ECG can be performed in your veterinarian’s office as an outpatient visit. No special preparation is typically required for this procedure.
Your dog will be required to remain still for this test, either standing or laying down on an examination table. The ECG electrodes are applied to your dog’s skin, at the base of each of his four legs. Rubbing alcohol or a special conduction gel may also be applied to help the electrical impulses travel more easily from your dog’s body into the ECG electrodes.
Once the electrodes are applied, your dog will be kept still for a brief period of time, in order to allow the ECG to record the electrical impulses passing through the heart. Your dog’s electrical conduction may be traced for less than a minute or for several minutes, depending on what abnormality your veterinarian suspects and how effectively your dog is able to remain still for a high-quality ECG recording.
After the test is run, it may be interpreted in-house by your veterinarian or it may be sent out to a veterinary cardiologist for interpretation.
In some cases, the ECG machine may be attached to your dog and left in place for 24 hours or more. This test, called a Holter Monitor, can help your veterinarian detect arrhythmias that are occurring uncommonly.
Reading ECGs in veterinary patients
Understanding the basic electrical principles of the heart is essential for interpreting this valuable diagnostic test.
Interpretation of the ECG
Basic interpretation of the ECG can be achieved by asking a few simple questions when faced with the ECG trace. The most important aspects of interpretation involve the determination of the heart rhythm and assessment of whether the rhythm is normal or not. The ECG may also provide clues as to the presence of enlargement of some cardiac chambers.
Is the ECG of a diagnostic quality? i.e., free from artefact, labelled and within the boundaries of the paper.
If the ECG is of a poor quality or not properly labelled then less information can be obtained. Subtle changes can be missed when there is considerable artefact. The time to notice artefact is when the trace is being recorded as another trace can be recorded at that time.
Electrocardiography is the recording at the body surface of electrical activity in the heart. It is a record of the average electrical potential generated in the heart graphed in voltage and time. Specific waveforms represent stages of myocardial depolarization and repolarization.
The electrocardiogram (ECG) is a valuable diagnostic test in veterinary medicine and is easy to acquire. It is the most important test to perform in animals with an auscultable arrhythmia (other than sinus arrhythmia in dogs). The ECG may also yield useful information regarding chamber dilation and hypertrophy. However, the ECG does not record cardiac mechanical activity, so it does not yield information regarding cardiac contractility. It’s also important to remember that the ECG may be normal even in the face of advanced cardiovascular disease.
The bipolar triaxial lead system we use today was developed by Dutch physiologist Willem Einthoven in the early 20th century, along with the P-QRS-T terminology that describes the ECG waveform complexes. A lead consists of the electrical activity measured between a positive electrode and a negative electrode. The orientation of a lead with respect to the heart is called the lead axis. Electrical impulses with a net direction toward the positive electrode will generate a positive waveform or deflection, and those directed away from the positive electrode will generate a negative waveform or deflection.
As the angle between the lead axis and the direction of the activation wave increases, the ECG deflection in that lead becomes smaller. Electrical impulses with a net direction perpendicular to the positive electrode will not generate a waveform or deflection at all and are said to be isoelectric.
Standard electrocardiographic leads are used to create multiple angles to assess the waveforms that travel through the three-dimensional heart. A single lead would provide information on only one dimension of current flow. For the purposes of this overview, we’ll focus on lead II, a bipolar lead in which the right arm (RA—the right foreleg in veterinary patients) is negative and the left leg (LL—or left hind leg), is positive (Figure 1). We will be discussing primarily rhythm diagnosis.
Figure 1
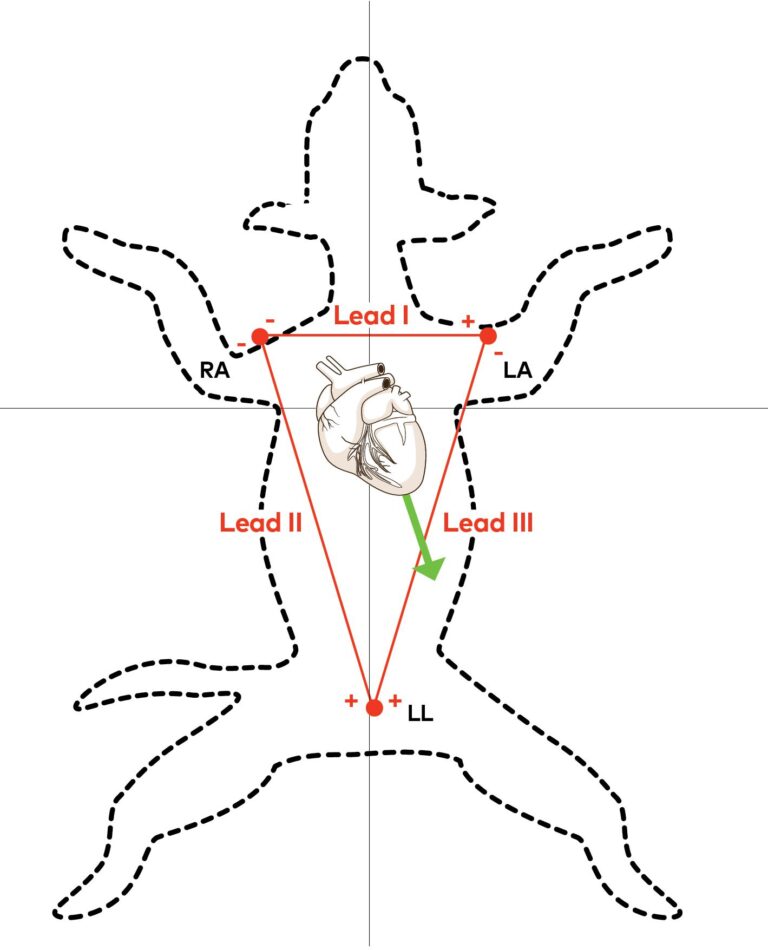
Figure 1. The three bipolar frontal plane leads (I, II and III) and Einthoven’s triangle (red). In lead I, the right foreleg (RA) is negative and the left foreleg (LA) is positive. In lead II the right foreleg (RA) is negative and the left hind leg (LL) is positive. In lead III the left foreleg (LA) is negative and the left hindleg (LL) is positive. The net depolarization moving through the ventricles (green arrow) is normally oriented toward the left hind leg (the positive pole of lead II) in dogs and cats, and therefore the QRS complex is predominantly positive in lead II. With ECG machines that utilize four electrodes, the electrode placed on the right hind leg is the ground (it is not part of any of the leads).
Recording the ECG
The ECG should be recorded in an area as quiet and distraction-free as possible. Noises from clinical activity and other animals may significantly affect a patient’s heart rate and rhythm. In quadripeds, the magnitude and direction of electrocardiographic vectors determined from limb leads can be vastly altered by changes in the position of muscular attachments of the shoulder girdle to the thorax.
Each pair of limbs should be held in parallel and limbs should not be allowed to contact one another. The animal should be held as still as possible during the ECG, and panting in dogs should be prevented if possible. In some cases, gently holding the animal’s mouth shut or placing a hand on the chest, if trembling is present, may be helpful. Alligator clips or adhesive electrodes may be used, although alligator clip teeth should be blunted and the spring relaxed to minimize discomfort.
Limb electrodes are placed distal to the elbow and stifle joints and wetted with 70% isopropyl alcohol or ECG paste to ensure good electrical contact. If the ECG complexes are too large to fit entirely within the grid of the paper, the calibration should be changed from standard (1 cm = 1 mV) to one-half standard (0.5 cm = 1 mV). The voltage and paper speed calibrations used for the recording must be inscribed during the recording so that this information is part of the permanent record.
Evaluation of the ECG
Areas of artifact should be identified as the ECG is being recorded so they can be addressed if possible. Electric (60-cycle) noise may be due to poor electric grounding (of the subject, the electrocardiograph or the table on which the ECG is being performed) or adjacent equipment such as lights or other electrical equipment. Electric noise appears on the ECG as regular fine, sharp, vertical oscillations. As mentioned earlier, placing a hand on the animal’s thorax may aid in reducing trembling or respiratory artifacts.
It’s important that artifacts not be misinterpreted during ECG evaluation. The heart rate (atrial and ventricular) should be calculated and waveform amplitudes and interval durations measured on a section of the ECG (lead II) that is run at a paper speed of 50 mm/sec. On a normal ECG, each P wave is followed by a QRS complex at a species-specific normal interval. Specific measurements to obtain for thorough ECG interpretation include:
- P wave amplitude and duration
- P-R interval duration
- QRS complex duration
- R-wave amplitude
- QT segment duration.
Additionally, the mean electrical axis and the cardiac rhythm should be determined. Rhythm analysis will be discussed below.
Electrophysiology principles
Several principles are important to remember when undertaking ECG rhythm assessment. All normal cardiac cells are capable of depolarizing when stimulated by a neighboring cell (excitability) and subsequently stimulate discharge of their neighboring cells. This capability is termed conductivity. However, only certain cells are capable of automaticity (beating on their own). These pacemaker cells undergo spontaneous depolarization (the resting potential becomes less negative) during diastole until the threshold potential is reached. Changes in the speed of spontaneous depolarization occur gradually over several heart cycles. Therefore, tachycardia associated with pacemaker cells (for example, sinus tachycardia) speeds up gradually over several seconds, unlike tachycardia originating from ectopic foci, which often accelerates abruptly.
Specialized cells in the sinus node, atrioventricular (AV) node, and His-Purkinje system are capable of automaticity. However, under normal circumstances, pacemaker cells outside the sinoatrial (SA) node do not reach threshold because the depolarization wavefront from the sinus node discharges them before they automatically depolarize. This is because pacemaker cells distal to the sinus node, called subsidiary pacemaker cells, have a slower depolarization rate than the sinus node. Immediately after depolarizing, cardiac cells are refractory. Once the cell has returned to its resting potential it is again excitable (it can be activated again).
Evaluation of waveforms
The P wave is generated by atrial depolarization. P waves may be absent in several dysrhythmias, including atrial fibrillation and atrial standstill. Alternatively, P waves may be buried in other waveforms (and therefore not visible), which commonly occurs in supraventricular tachycardia (Figure 2). P wave enlargement (taller or wider than normal) is recognized as an indicator of atrial enlargement.
Figure 2
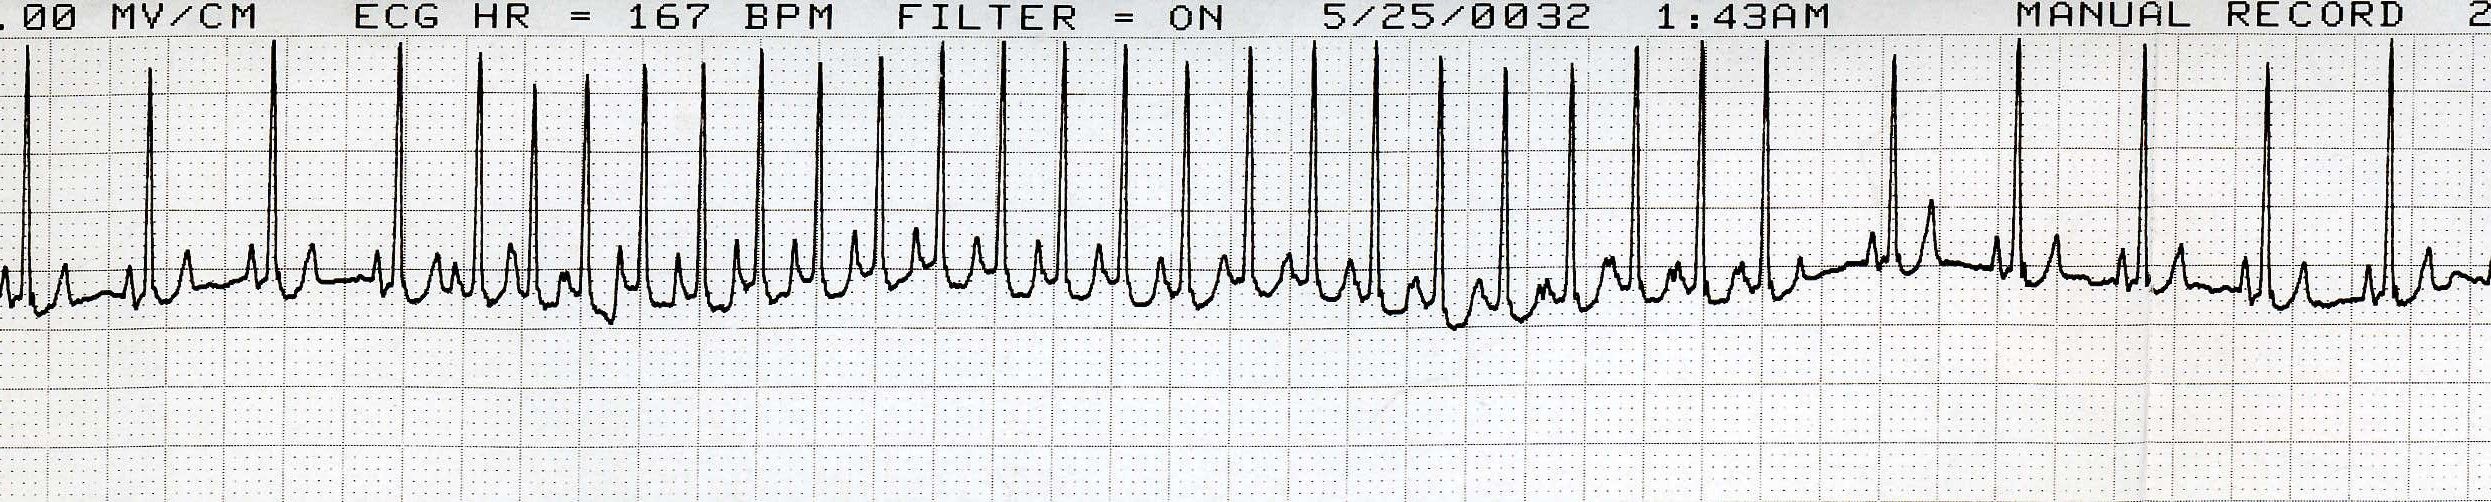
Figure 2. Lead II ECG from a dog (25 mm/sec; 10 mm/mV).
Heart rate: 150 bpm in early and late portion of strip; heart rate in middle section is 300 bpm; tachycardia.
R-R regularity: Regularly irregular in early and late portion of strip; regular in middle section.
QRS morphology: Narrow, normal-looking QRS shape; supraventricular origin.
P waves: There is a P wave for every QRS complex and a QRS complex for every P wave, except in the region of tachycardia.
Rhythm diagnosis: Sinus rhythm with supraventricular tachycardia or atrial tachycardia. (Because of the abrupt transition to and from sinus rhythm and the rapid rate, sinus tachycardia can be ruled out.)
The P-R interval represents atrial depolarization and conduction through the AV node. Prolongation of the P-R interval is termed first-degree AV block. Depolarization that originates in the ventricle (either a ventricular premature complex [VPC; Figure 3] or an escape beat) will not spread through the rapid conduction pathway but will instead spread cell to cell in a slower fashion, resulting in a widened, abnormal QRS complex. The resultant T wave will also be abnormal and usually discordant (in the opposite direction of the QRS complex).
Figure 3
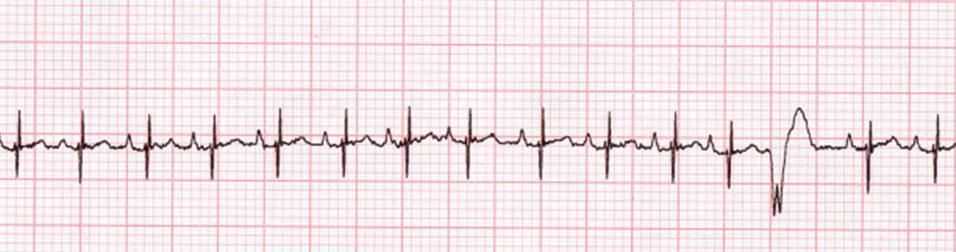
Figure 3. Lead II ECG from a dog (25 mm/sec; 5 mm/mV).
Heart rate: 170 bpm; normal to mildly elevated.
R-R regularity: Regularly irregular (the heart speeds up and then slows down gradually in a regular rhythm); one complex is earlier than the others.
QRS morphology: Narrow, normal-looking QRS shape except for the one complex that is earlier than the others; predominantly supraventricular rhythm with one wide QRS complex that is premature.
P waves: There is a P wave for every QRS complex and a QRS complex for every P wave, except for the wide complex.
Rhythm diagnosis: Mild sinus tachycardia with one ventricular premature contraction.
Ventricular enlargement may alter QRS deflections, duration or amplitude. Aberrant conduction, such as through right or left bundle branch, can also alter the QRS duration and morphology (shape) for a similar reason. If conduction through a ventricular bundle branch is blocked, the depolarization wavefront cannot spread along the rapid conduction pathway in the affected ventricle. Conduction still spreads from cell to cell, but it is much slower (hence the widened QRS). Other causes of wide QRS complexes include electrolyte abnormalities such as hyperkalemia and certain medications (i.e. some antiarrhythmic agents).
Assessing the rhythm
When evaluating the heart rhythm on an ECG, using a stepwise approach simplifies the process.
- Count the heart rate and determine if it is normal or abnormal(bradycardia or tachycardia). In cases of AV dissociation, there may be different atrialand ventricular rates.
- Look at R-R regularity.Rhythms originating from a single site in the ventricles or atria are often regular, whereas rhythms originating from the sinus node are often irregular due to variations in adrenergic activity (Figure 4).
Figure 4
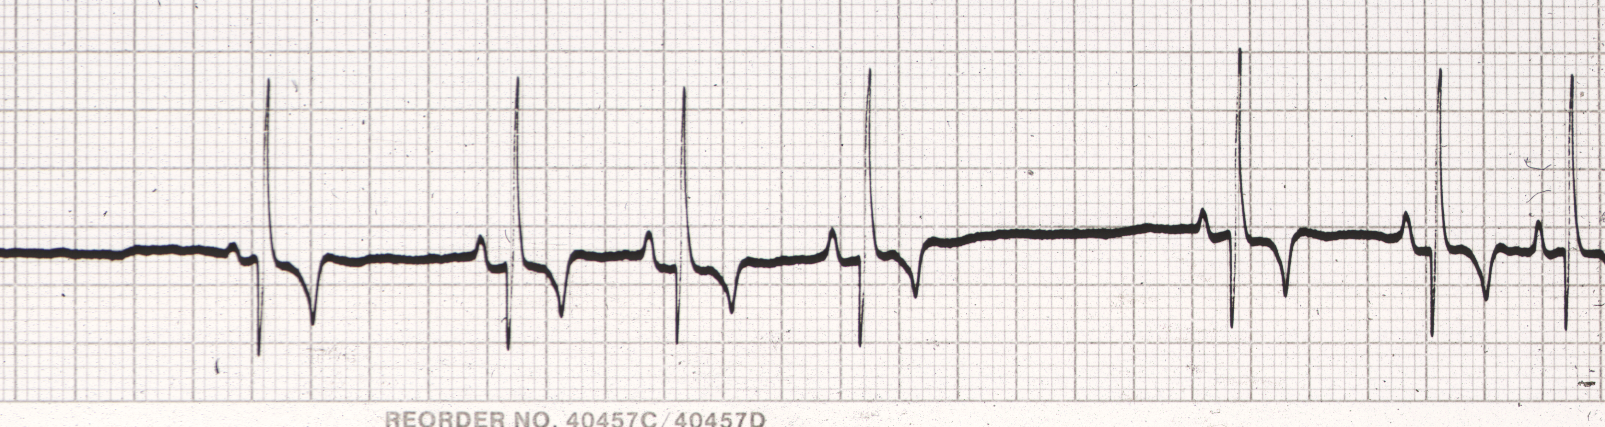
Figure 4. Lead II ECG from a dog (25 mm/sec; 10 mm/mV).
Heart rate: 90 bpm; normal.
R-R regularity: Regularly irregular (the heart speeds up and then slows down gradually in a regular rhythm).
QRS morphology: Narrow, normal-looking QRS shape; supraventricular origin.
P waves: There is a P wave for every QRS complex and a QRS complex for every P wave; P-wave shape looks normal.
Rhythm diagnosis: Sinus arrhythmia.
- Evaluate the shape or morphology of the QRS complex.Does it appear normal or wide? Causes of wider-than-normal QRS complexes include ventricular origin (Figure 5), electrolyte abnormalities (hyperkalemia), aberrant conduction (bundle branch block), ventricular hypertrophy or certain medications. Is there a P wave for every QRS complex and a QRS complex for every P wave? If so, sinus rhythm is likely. If there are P waves without QRS complexes, AV block is present.
Figure 5
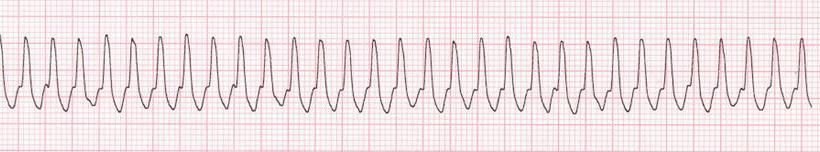
Figure 5. Lead II ECG from a dog (25 mm/sec; 5 mm/mV).
Heart rate: 300 bpm; tachycardia.
R-R regularity: Regular.
QRS morphology: Wide complex; ventricular (always keep in mind other possible causes of wide complex tachycardia, especially if rhythm doesn’t respond to therapy as expected).
P waves: Not visible.
Rhythm diagnosis: Ventricular tachycardia, sustained.
- Determine the degree of AV block.In first-degree AV block, every P wave produces a QRS complex but the AV conduction is slow and the P-R interval is therefore prolonged. If only some P waves block (i.e. do not result in a QRS complex), the rhythm is second-degree AV block (Figure 6). Second-degree AV block is further broken down into Mobitz type 1 (Wenkebach type), in which there is gradual lengthening of the P-R interval until a P wave blocks, or Mobitz type 2, in which the P-R intervals are constant. Complete dissociation (there are P waves and QRS complexes but no connection between them) is present with third-degree or complete heart block
Figure 6
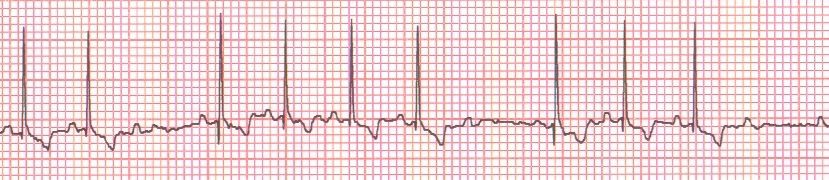
Figure 6. Lead II ECG from a dog (25 mm/sec; 5 mm/mV).
Heart rate: 130 bpm; normal.
R-R regularity: Regularly irregular (the heart speeds up and then slows down gradually in a regular rhythm).
QRS morphology: Narrow, normal-looking QRS shape; supraventricular origin.
P waves: Several P waves occur without a following QRS complex (after the second, sixth and ninth QRS complexes).
Rhythm diagnosis: Second-degree AV block (P-R interval is fixed; therefore, second-degree AV block type 2).
As with any clinical skill, becoming adept at ECG interpretation requires practice. Understanding the basic electrical principles of the heart is helpful for reading all ECGs, and it is essential for interpretation of more complex arrhythmias.
Dr. Sleeper is a clinical professor of cardiology at the University of Florida College of Veterinary Medicine who has published more than 75 peer-reviewed original articles, 50 review articles or case reports, and four books.
Why would my veterinarian want to perform an electrocardiogram?
An ECG is often a component of the workup for any dog suspected of having heart disease.
Clinical signs of heart disease that you may see at home, which might indicate a need for an ECG, can include any of the following:
- weakness
- lethargy
- exercise intolerance
- shortness of breath
- coughing
Even if your dog is not showing signs of heart disease at home, your veterinarian may also recommend an ECG if your dog has physical exam findings that are suggestive of heart disease. These findings may include:
- an irregular heartbeat
- a heart murmur (which indicates turbulent blood flow over a valve within the heart)
- irregular pulses
- abnormal lung sounds
An ECG may also be performed as a screening test in geriatric dogs or dogs that are undergoing anesthesia. Additionally, ECG monitoring is common in dogs of any age when they are under general anesthesia.
What information can be gained from an electrocardiogram?
An ECG can provide your veterinarian with a variety of information about your dog’s heart function.
- Is the heart rate normal? An ECG allows an accurate determination of your dog’s heart rate. This can reveal whether his heart is beating at a normal pace, or whether it is beating too quickly or too slowly. An elevated or decreased heart rate can suggest specific medical issues that may warrant investigation.
- Is the heart rhythm normal? An ECG provides a very accurate way for your veterinarian to assess your dog’s heart rhythm. If his heart rhythm is abnormal, analysis of the ECG results can diagnose the exact arrhythmia that is present and suggest likely underlying causes for this arrhythmia.
- Does the dog’s heart size appear to be normal? An ECG measures electrical conduction through the heart. Enlarged heart tissue conducts electricity differently than normal heart tissue; therefore, an ECG can sometimes suggest abnormalities in the size of specific heart chambers. While this determination is not completely accurate or reliable, it can suggest the need for further investigation via radiographs (X-rays) or echocardiography (an ultrasound of the heart).
Interpretation of Rhythm
What is the Heart Rate?
Many significant rhythm disturbances disturb the heart rate. Arrhythmias that lead to an increase in heart rate are described as tachycardias. Arrhythmias that lead to a decrease in heart rate are called bradycardias. Instantaneous heart rate can be calculated on the basis of the R-R interval from one complex to the next. An average rate can be taken by counting the number of depolarisations within 6 seconds and multiplying by ten. Where the rhythm is very irregular a more accurate rate may be obtained by counting over 12 seconds.
Rates are therefore calculated as below:
- a) Method of calculation of average heart rate (paper speed 25 mm/sec):
A distance of 15 centimeters from one R-wave is inspected on the lead II ECG strip. The number of R-R intervals in this 15 centimeters is calculated to the nearest half interval. This number is then multiplied by ten to provide the average heart rate to the nearest five beats per minute.
- b) Method of calculation of the instantaneous heart rate (paper speed 25 mm/sec):
If the R-R interval is x mm the instantaneous heart rate is calculated as
HR = 1500/x beats per minute.
Where the ECG is recorded at 50 mm/sec the heart rate is calculated as
HR = 3000/x beats per minute.
Determination of Rhythm
Evaluation of the heart rhythm involves examining the ECG for evidence of the normal relationship between the P-waves and the QRS complexes. This can be done in the following way:
Is There a P-Wave for Every QRS Complex?
Where a QRS complex arises without a normal P-wave it implies that the atria did not depolarise normally prior to ventricular depolarisation. This can occur when the depolarisation resulting in the QRS complex arises in the wrong place, or the atria are unable to depolarise normally. The possibilities are therefore either
Ventricular depolarisation
Junctional depolarisation (The junction refers to the AV node and bundle of His)
Atrial standstill
Atrial fibrillation or
Sinus arrest with escape complexes
Is There a QRS Complex for Every P-wave?
If a P-wave is visible on the ECG and it is not followed by a normal QRS complex then there has been failure of conduction of the atrial depolarisation through the atrioventricular node in the normal way. This is described as atrioventricular block and can occur in many forms. There are three types commonly recognised and these are described as first, second and third degree AV block.
First degree AV block is a prolongation of conduction through the AV node. Second degree AV block is an occasional failure of conduction through the AV node and third degree AV block is complete failure of conduction through the AV node. In the latter case there must be an escape focus beneath the AV node to maintain ventricular depolarisation, albeit at a lower rate than normal.
Are the P-waves and QRS Complexes Consistently and Reasonably Related?
P-waves and QRS complexes may arise concurrently and yet not be related. This tends to show as an inconsistent relationship between the two and implies the presence of separate ventricular and atrial rhythms. This is described as atrioventricular dissociation.
Are the QRS Complexes and the P-waves All the Same?
Variation in the appearance of P-waves or QRS complexes may imply that they have originated from a different site or been conducted differently. This would normally suggest an abnormality of rhythm however some variation in P-wave amplitude can be normal in dogs and is described as a wandering pacemaker.
Is the Heart Rhythm Regular or Irregular?
If the rhythm is irregular is it regularly irregular or irregularly irregular. Normal rhythms tend to be either regular, or regularly irregular. An irregularly irregular rhythm is almost always abnormal. The most common rhythm of this type is atrial fibrillation; this sounds chaotic. Auscultation is a more sensitive way of determining the regularity of a rhythm.
What is the Mean Electrical Axis?
The mean electrical axis can be calculated from the magnitude of the deflection of the QRS complex in six leads. This may help to determine if chamber enlargement has taken place or if there is an abnormality of conduction such as a bundle branch block.
|
Where normal complexes are visible, i.e., those that appear to have arisen in the normal sequence from sino-atrial node to atrioventricular node to the ventricle, then measurement of the amplitude of the constituents of the complexes may be useful in providing information regarding the presence of chamber enlargement. There are a few patterns of chamber enlargement described.
Right atrial enlargement (RAE) may be represented by the presence of a tall P-wave, i.e., greater than 0.4 mV. This is sometimes also described as P-pulmonale.
Left atrial enlargement (LAE) may be represented by the presence of a wide P-wave, i.e., longer duration than 0.06 seconds. The P-wave may also become notched or M shaped. This is sometimes described as P-Mitrale.
Left ventricular hypertrophy (LVH) may be signified by the presence of tall R-waves, wide QRS complexes and a shift of the mean electrical axis to the left.
Right ventricular hypertrophy (RVH) may be signified by the presence of deep S-waves in leads I, II and III. There may be a shift of the mean electrical axis to the right.
Unfortunately none of these changes is specific to chamber enlargement. There is considerable overlap between normal animals and those affected by hypertrophy. For this reason the chamber enlargement suggested by the ECG must be interpreted in the light of other available information e.g., radiographs, echocardiography or post-mortem data.
Heart Function
The normal heartbeat begins with depolarization of specialized tissue called the sinoatrial node, located in the cranial right atrial wall (FIGURE 1). This impulse is propagated through the tissue of both atria in a wavelike pattern. The electrical activity of the atria is insulated from the ventricles by the fibrous cardiac skeleton, which forces all electrical activity to travel to the ventricles through the atrioventricular (AV) node near the intraventricular septum. After entering the AV node, the electrical impulse is conducted via specialized conduction cells through the bundle of His and then into the bundle branches, which divide into right and left bundle branches, each innervating its respective ventricle. After reaching the termination of the bundle branches, the impulse is transmitted through Purkinje fibers to the myocytes. Stimulated by the electrical impulse, the myocytes stimulate their neighboring cells and conduct the impulse, cell to cell, causing ventricular contraction.1 These events are represented on the ECG as the waveforms. Atrial repolarization is not visible on the ECG because it is obscured by the QRS complex.
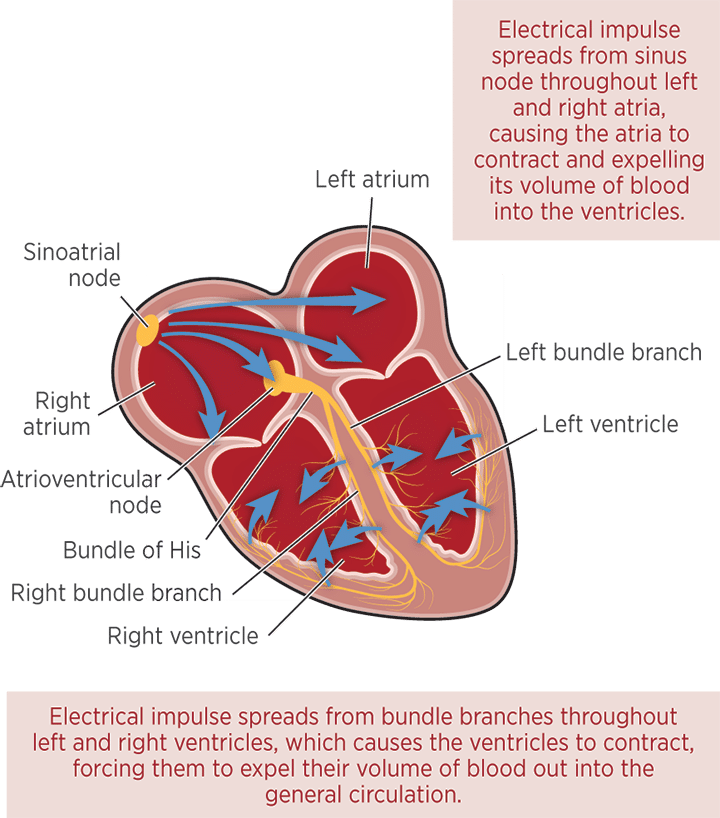
FIGURE 1. Schematic of the cardiac conduction system. Blamb/shutterstock.com
Heart Rhythms
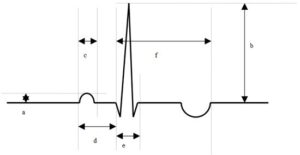
Heartbeats that originate in the sinoatrial node, which are normally propagated to the ventricles, are termed sinus beats. Sinus beats (or sinus rhythm) are considered normal and in lead II will appear on ECG as a positive P wave, slightly negative Q wave, strongly positive R wave, and slightly negative S wave. In veterinary patients, the T wave may be positive, negative, or diphasic (i.e., both negative and positive) (FIGURE 2).
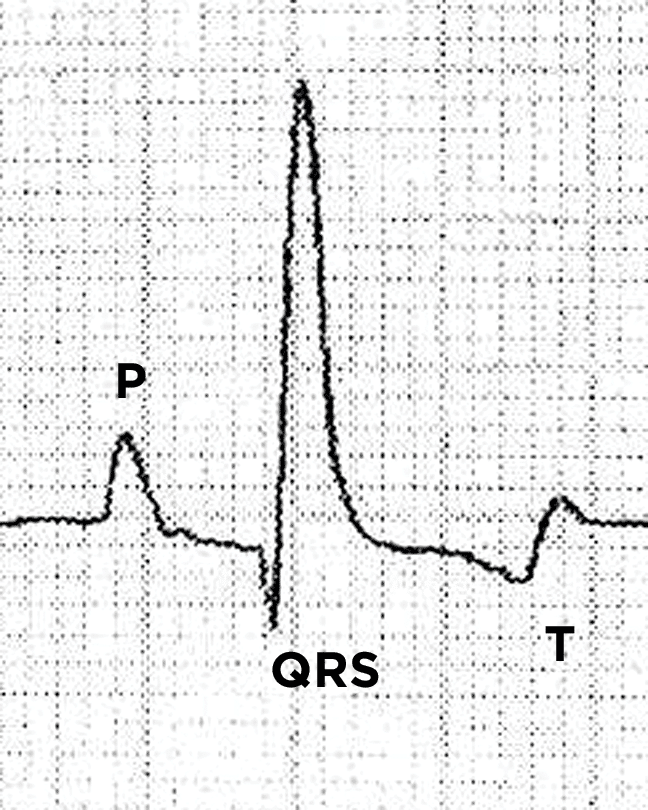
FIGURE 2. Electrocardiogram showing normal sinus rhythm in a dog. The P wave indicates atrial depolarization, the QRS complex indicates ventricular depolarization, and the T wave indicates ventricular repolarization. This tracing demonstrates a normal positive P wave, a negative Q wave, positive R wave, and no distinct S wave in this lead (which is considered a normal variation). The T wave of the dog may be positive, negative, or diphasic (both negative and positive) as seen here; these are all considered normal.
Any arrhythmia affecting the P wave represents changes in atrial conduction. Any arrhythmia affecting the QRS complex represents changes in ventricular conduction. Arrhythmias involving the atria are categorized as supraventricular. Arrhythmias involving the ventricles are termed ventricular.
Arrhythmias can be divided into 2 broad categories: those caused by abnormal impulse formation and those caused by abnormal conduction. Some patients will demonstrate both during the same recording. Either type of arrhythmia may be responsible for bradycardia or tachycardia.
Abnormal impulse formation: A premature beat is caused by formation of an abnormal impulse and occurs early in the expected rhythm (FIGURE 3). Examples of abnormal impulse formation are ventricular premature complexes and atrial premature complexes. Ventricular tachycardia (FIGURE 4) is a series of 4 or more abnormal ventricular impulses occurring at a rapid rate. This potentially fatal rhythm should be reported to the veterinarian immediately. An escape beat is an abnormal impulse formed because of a delay in normal depolarization; escape beats arrive late in the expected rhythm. Although the escape beat is technically abnormal, it is a rescue mechanism that keeps the patient alive.
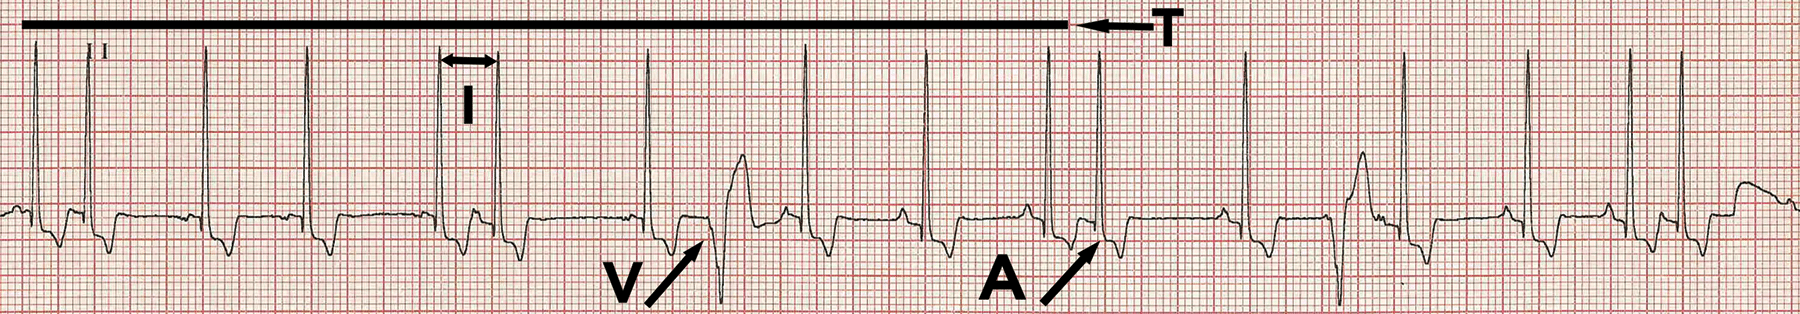
FIGURE 3. Heart rate (HR) calculations and premature complexes. Lead II, 25 mm/sec, 10 mm/mv. Line T demarcates 30 × 5–mm boxes (15 cm) or 6 seconds at this paper speed. To calculate HR, count the number of complexes within the line, which in this case is 11. Multiply 11 by 10 (60 seconds/minute divided by 6 seconds within the line = 10) to get an HR of 110 bpm. Line I represents calculation of an instantaneous HR. There are 8 1-mm boxes between the indicated QRS complexes. At 25 mm/sec, each box equals 40 milliseconds. Multiply 8 by 40 to arrive at 320 milliseconds between these 2 beats, then divide 60 000 by 320 to get an HR of 187 bpm. This calculation indicates that if this interval persisted, the HR would be 187 bpm. Arrow V points to a ventricular premature complex, and arrow A points to a supraventricular premature complex (commonly called an atrial premature complex).
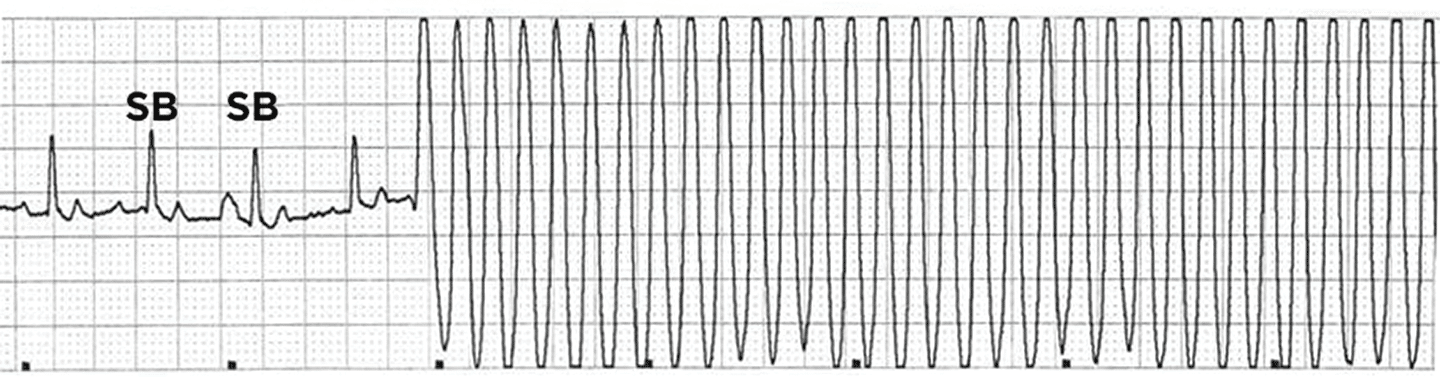
FIGURE 4. Ventricular tachycardia; lead II, 25 mm/sec, 10 mm/mv. This electrocardiogram tracing shows a sinus rhythm (indicated by SB for sinus beat) that suddenly changes to a rapid ventricular tachycardia. The heart rate (HR) during sinus rhythm, calculated by using the instantaneous method, is 125 bpm. The HR during ventricular tachycardia is approximately 375 bpm; this rhythm is often referred to as “R on T” phenomenon and is potentially life-threatening. This rhythm can degenerate into ventricular fibrillation or asystole without warning.
Abnormal conduction: Abnormal conduction can occur at any level of the conduction system. If the sinus impulse is stopped at the AV node from reaching the ventricle, then AV block has occurred. If the impulse leaves the AV node but is blocked in the lower ventricular conduction system, then a bundle branch block has occurred.
Recording the ECG
Recording an ECG involves placing electrodes on the patient on opposite sides of the heart. The electrodes are connected to a computer designed to measure the electrical activity between them. Electrodes are polarized as positive or negative. As the electrical impulse moves through the heart toward a positive electrode, a positive deflection is traced on the ECG. The reverse is true if the impulse moves toward a negative electrode. An ECG lead is an angle created across the heart by the placement of the 2 electrodes; the tracing reflects direction and magnitude. The standard electrode arrangement creates 3 bipolar leads (TABLE 1). Electrocardiographic paper is graph paper. On the paper are bold lines indicating 5-mm boxes, within which are smaller grids of 1-mm boxes. When combined with paper movement speed and an electrical amplitude calibration, time and electrical voltage can be accurately calculated. The common paper speeds are 25 mm/sec and 50 mm/sec. The standard calibration is 10 mm/mv. For a complete multivariant analysis of the ECG, the patient must be in right lateral recumbency with other leads being recorded. Use of leads other than lead II is beyond the scope of this article. All changes to the ECG discussed in this article will be about lead II. Normal ECG values for waveform amplitudes, durations, and intervals are widely published.
Using the ECG to Calculate Heart Rate
Before beginning any interpretation, first note what is termed CLAP (the amplitude Calibration, Lead displayed, any Artifact, and Paper speed). Then determine the HR. This step quickly identifies the presence of bradycardia or tachycardia. Because HR is a component of cardiac output, an abnormal HR can have a deleterious effect on cardiac output. Decreased cardiac output may be noted as hypotension in the patient. Monitors may display HR for the operator, but these values should be viewed with scrutiny because the HR algorithm may incorrectly calculate HR as a result of artifact, arrhythmias, or excessively large ECG waveforms. A manual HR count is more accurate.
One way to manually calculate HR, useful for irregular rhythms, is to mark out 30 of the 5-mm boxes (a total 15 cm) on the ECG paper. This duration will equal 6 seconds at a paper speed of 25 mm/sec or 3 seconds at 50 mm/sec. To calculate the beats per minute (bpm), multiply the number of QRS complexes within the 30 boxes by 10 for a paper speed of 25 mm/sec or by 20 for 50 mm/sec. Another method, useful for rapid, or paroxysmal rhythms, is to calculate the instantaneous HR.4 To perform this calculation, count the number of 1-mm boxes between 2 QRS complexes and then multiply the result by 40 for a paper speed of 25 mm/sec or by 20 for a paper speed of 50 mm/sec (FIGURE 3). The product equals the milliseconds between the 2 beats, which is then divided into 60 000, which is equal to the number of beats per minute.
Steps for Assessing Heart Rhythms
- Determine the Heart Rate
The first step is determining the HR, as described above. The rate will immediately define the presence of a bradycardia or tachycardia, thus providing focus for all subsequent interpretations of the ECG.
- Determine the Predominant Rhythm
By assessing most beats, the predominant rhythm can be determined. The most common rhythms of dogs are normal sinus rhythm and sinus arrhythmia, at a rate of 60 to 170 bpm.2-4 The most common rhythm of cats is sinus rhythm at a rate of 140 to 220 bpm.2-4 Sinus rhythm is a regular rhythm displayed on ECG as a P–QRS–T wave configuration. The P wave is positive with a predominantly positive QRS complex. Sinus arrhythmia is a normal rhythm of dogs but will be irregular in a repeating pattern. Most arrhythmias are sustained long enough to be a predominant rhythm. Atrial fibrillation (FIGURE 5) is an exception caused by chaotic depolarization of the atria, most often associated with heart disease. Atrial fibrillation is recognized by tachycardia, lack of P waves, a positive QRS complex, and an irregular R–R interval. A wildly jagged baseline may also be noted as the fibrillation waves are recorded. It is uncommon for atrial fibrillation to return to normal sinus rhythm.
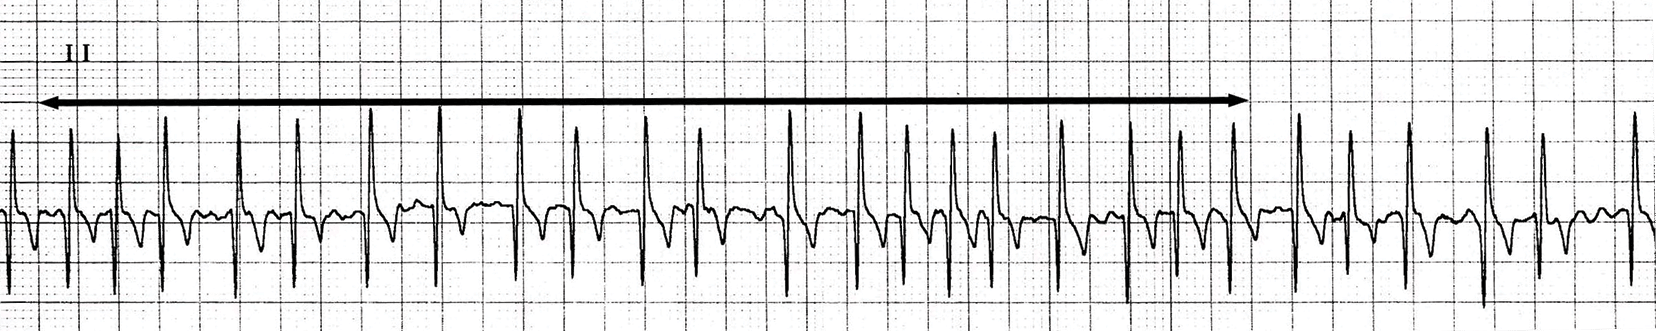
FIGURE 5. Atrial fibrillation; lead II, 25 mm/sec, 20 mm/mv. This electrocardiogram tracing is an example of atrial fibrillation. The double arrow line indicates 6 seconds. The average heart rate (HR) is a tachycardia of 200 bpm, there are no consistent visible P waves, and the QRS complexes are narrow and predominantly positive. These are the hallmarks of atrial fibrillation. The irregularity of the R–R interval is common with atrial fibrillation, but it should be noted that with a very rapid HR during atrial fibrillation, the R–R interval may become regular.
- Determine the Anatomic Source of the Rhythm
Knowledge of the anatomic source of an arrhythmia can be used to guide therapy. Treating supraventricular arrhythmias requires different medications than those used for ventricular arrhythmias. The simplest way to assess the source is to look at the width of the QRS complex.
When the arrhythmia origin is supraventricular, the complexes are typically positive and narrow in lead II, shorter than 70 milliseconds.4 A positive, narrow QRS complex is created when atrial beats move down the normal conduction tissue to depolarize the ventricle.
When the arrhythmia originates in the ventricles, the complexes are wider than 80 milliseconds and show slurring of the Q–T segment; these complexes are commonly described as “wide and bizarre.” These beats do not use the normal cardiac conduction system. They propagate slowly across the ventricular myocardium, cell to cell, making the wide QRS complex.
- Determine Whether All Waves Are Present
Every sinus beat will generate P–QRS–T waveforms. The complexes formed by premature atrial and ventricular beats will lack P waves because they are abnormally formed in the atrial or ventricular tissue. Wide complexes not associated with P waves should be considered ventricular in origin until proven otherwise. Ventricular bundle branch blocks are indicated by wide complexes (>80 milliseconds)5,6 with associated and consistent P waves. AV block will often appear as P waves with no accompanying QRS–T waveforms (FIGURE 6).
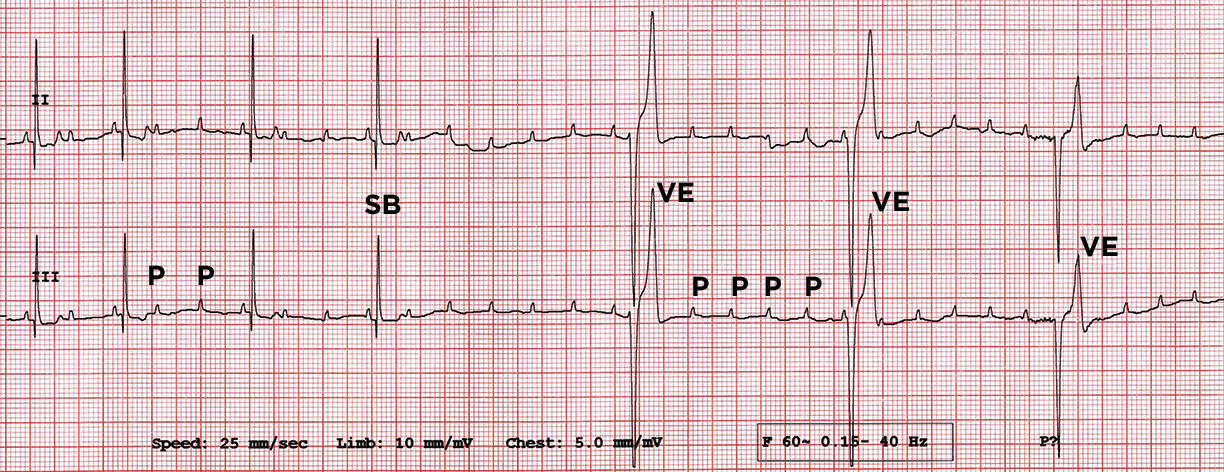
FIGURE 6. Atrioventricular (AV) block; leads II and III, 25 mm/sec, 10 mm/mv. This electrocardiogram tracing indicates both second and third degree AV block. The beginning of the tracing shows some normally conducted P waves creating a sinus beat (SB). The P–Q interval is fixed at 80 ms, making this a Mobitz II second degree AV block. The heart rate (HR) at the second-degree AV block in the beginning of the trace is approximately 57–60 bpm. P indicates blocked P waves. Had these P waves been conducted, HR would be approximately 185 bpm. Approximately halfway through the tracing, the AV block becomes third degree (complete AV block). Blocked P waves can be seen, still at a rate of around 185 bpm. Three ventricular escape (VE) beats occur at a rate of 33–37 bpm according to this short tracing. These complexes are wider than they are during sinus rhythm and show the characteristic S–T segment slurring of complexes of ventricular myocardial origin. An individual P wave can be seen “buried” within the T wave of the second VE beat.
AV block has 3 recognized forms: first, second, and third degree.
- First degree AV block is recognized as a prolonged P–Q interval, but all P waves do have associated QRS–T complexes.
- Second degree AV blockshows intermittent blocking of P waves and some normal complexes. The P–QRS interval in second degree block may be progressively elongated (Mobitz I), can be normal, or can have fixed elongation (Mobitz II) before atrial conduction is blocked.
- Third degree AV block is a total dissociation of P waves from the QRS–T complexes. Patients with third degree AV block rely on a rhythm of ventricular escape beats to maintain cardiac output; these patients are bradycardic (30 to 60 bpm) and often syncopal.
Managing Arrhythmias
A detailed description of arrhythmia therapy is beyond the scope of this article; however, some general information is warranted. The decision of whether an arrythmia warrants treatment depends on the hemodynamic consequences, the likelihood of an increase in severity, and the risks posed by medication.
- Hemodynamic consequences:Perhaps the most important consideration for determining when to treat an arrhythmia is its hemodynamic consequence. The simplest way to assess hemodynamic consequence is by measuring the patient’s blood pressure (BP). Accelerated idioventricular rhythm is a ventricular rhythm commonly seen after abdominal surgery, especially splenectomy. The ventricular rate is only 10% faster than the underlying sinus rhythm,7 and the patient is largely normotensive. No therapy is required; this rhythm self-resolves as the patient heals from surgery. If the arrhythmia is lowering BP, it can be presumed that cardiac output is depressed, and therapy is indicated, especially when monitoring anesthesia. Sinus bradycardia that follows use of α-2 agonists (e.g., dexmedetomidine) is common, but BP is usually normal initially; hence, no therapy is needed. However, if bradycardia persists as hypotension over time, increasing HR is indicated because of the hypotension.
- Likelihood of severity increase:The next consideration is whether the arrhythmia is likely to increase in severity. Ventricular tachycardia can quickly degenerate into fatal ventricular fibrillation; thus, emergency therapy with lidocaine is indicated.
- Risk from medication:The final consideration is the risk posed by therapy. All antiarrhythmic medications can be proarrhythmic. Atropine, given during anesthesia for bradycardia, often causes a transient second degree AV block, which has minimal effect on BP and, because it tends to be transient, requires no intervention. Another example is the use of digoxin to control supraventricular arrhythmias. Although digoxin slows AV nodal conduction and reduces ventricular response to arrhythmias such as atrial fibrillation, it also is arrhythmogenic for the ventricle.